July 11, 2023
Past the limit: Studying how often drivers speed in San Francisco and Phoenix
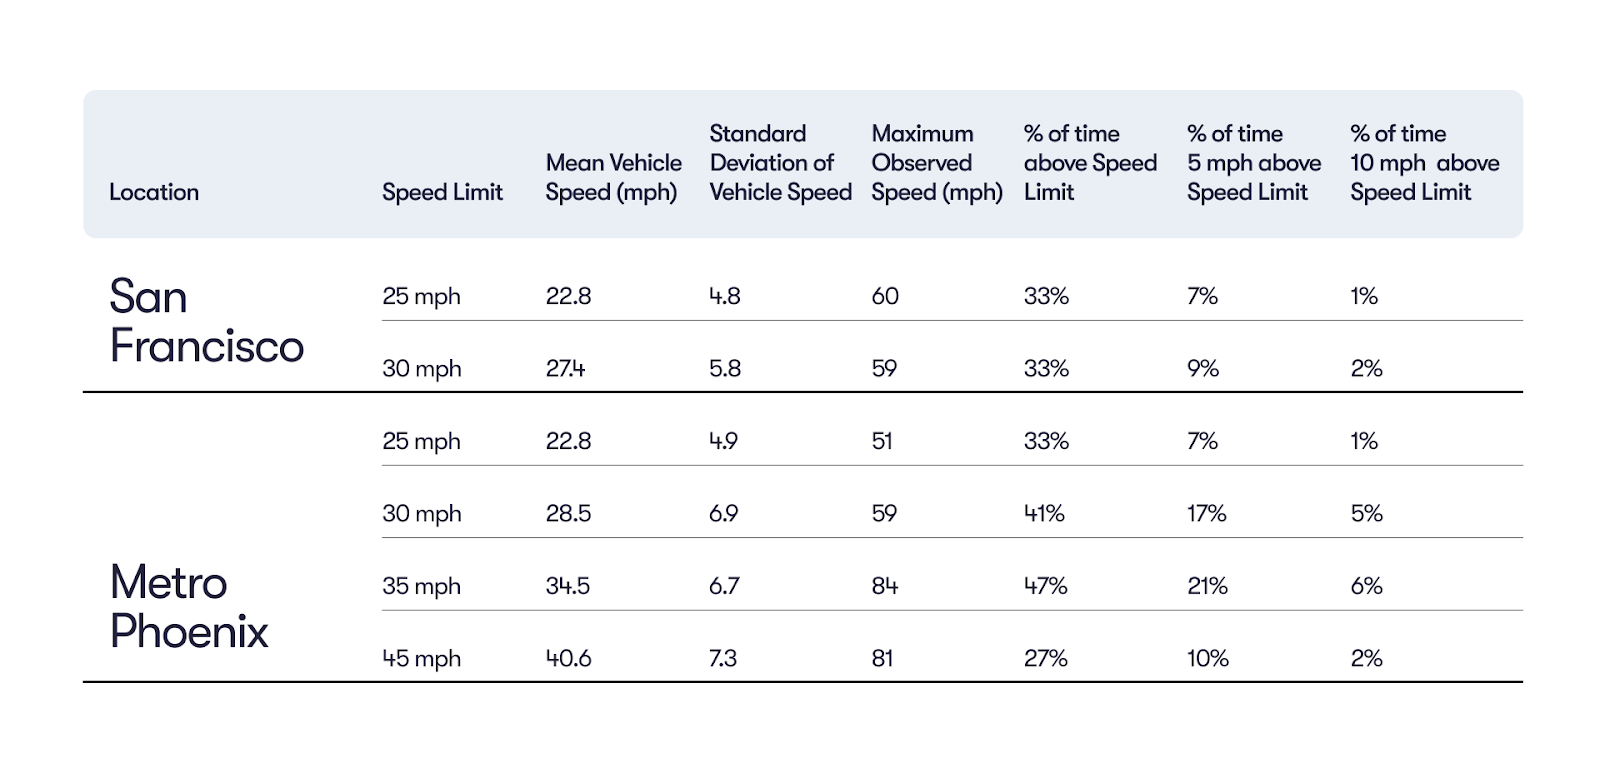
We recently analyzed the aggregated speeds of cars on the streets of San Francisco and Phoenix, and our study revealed that speeding is, unfortunately, a very common behavior. During the 10-day study period, we observed vehicles speeding up to almost half (47%) of the time, including instances of extreme speeding with cars going more than 25 mph over the posted speed limit. This shows a disturbingly high percentage of people ignoring the posted speed limit and putting themselves and others at risk. We are sharing our findings to help shed light on how pervasive this safety issue is and Waymo’s role in supporting safer streets.
Unlike humans, the Waymo Driver is designed to follow applicable speed limits. Our Driver can also detect the speed of other vehicles on the road. Doing so helps the Waymo Driver predict the likely next maneuvers of the vehicles around it and respond accordingly. This has important safety benefits: for example, if the Waymo Driver detects a car accelerating instead of slowing down for a red light, it will prepare to yield to it.
Because we can understand the speeding behavior of other cars, we were able to study speed patterns in San Francisco and Phoenix, where our fully autonomous Waymo One service operates. While it's well known that human drivers speed, quantifying the overall extent of speeding is hard because such incidents are dramatically underreported.
How we observed car speeds
We used our rider-only fleet, with no one behind the wheel, to collect anonymized, aggregate speed data across San Francisco and Phoenix between May 1–5 and May 8–12, 2023. The data was aggregated by speed limit for 25 mph, 30 mph, 35 mph, and 45 mph roads. As the city of San Francisco has a low number of 35 mph and 45 mph roads, only data for 25 mph and 30 mph speed limits is reported for SF.
Data was aggregated based on the posted speed limit of the road from our map. It was not adjusted for temporary or time dependent speed limits, like school or construction zones. While these temporary speed limits are important for safety and factored in the Waymo Driver’s behavior, they are much less common than permanent ones, so including them would not impact the results shown in this study. No information that could identify an individual vehicle was used as part of this study.
During this 10-day time period, we recorded the speeds of hundreds of thousands of vehicles across both cities. This provided us with hours of aggregated speed data and over 1 million speed observations.
.png)
Observed speeding behavior and safety implications
The study revealed that from the data collected, drivers in Phoenix and San Francisco exceeded the speed limit from a quarter (27%) to almost half (47%) of the time observed, depending on the road speed limit.

For the speed limits we examined, human drivers drove more than 5 mph over the speed limit between 7% and 21% of the time. While it may sound innocuous, 5 mph can make a big difference in both avoiding a collision and the consequences of a collision if it occurs. But what’s even more dangerous is extreme speeding. During the 10-day period, we observed vehicles going over 25 mph above the speed limit in every road category we reviewed. This means that drivers regularly go over 50 mph on roads with a 25 mph speed limit, and over 70 mph on roads with a 45 mph speed limit.
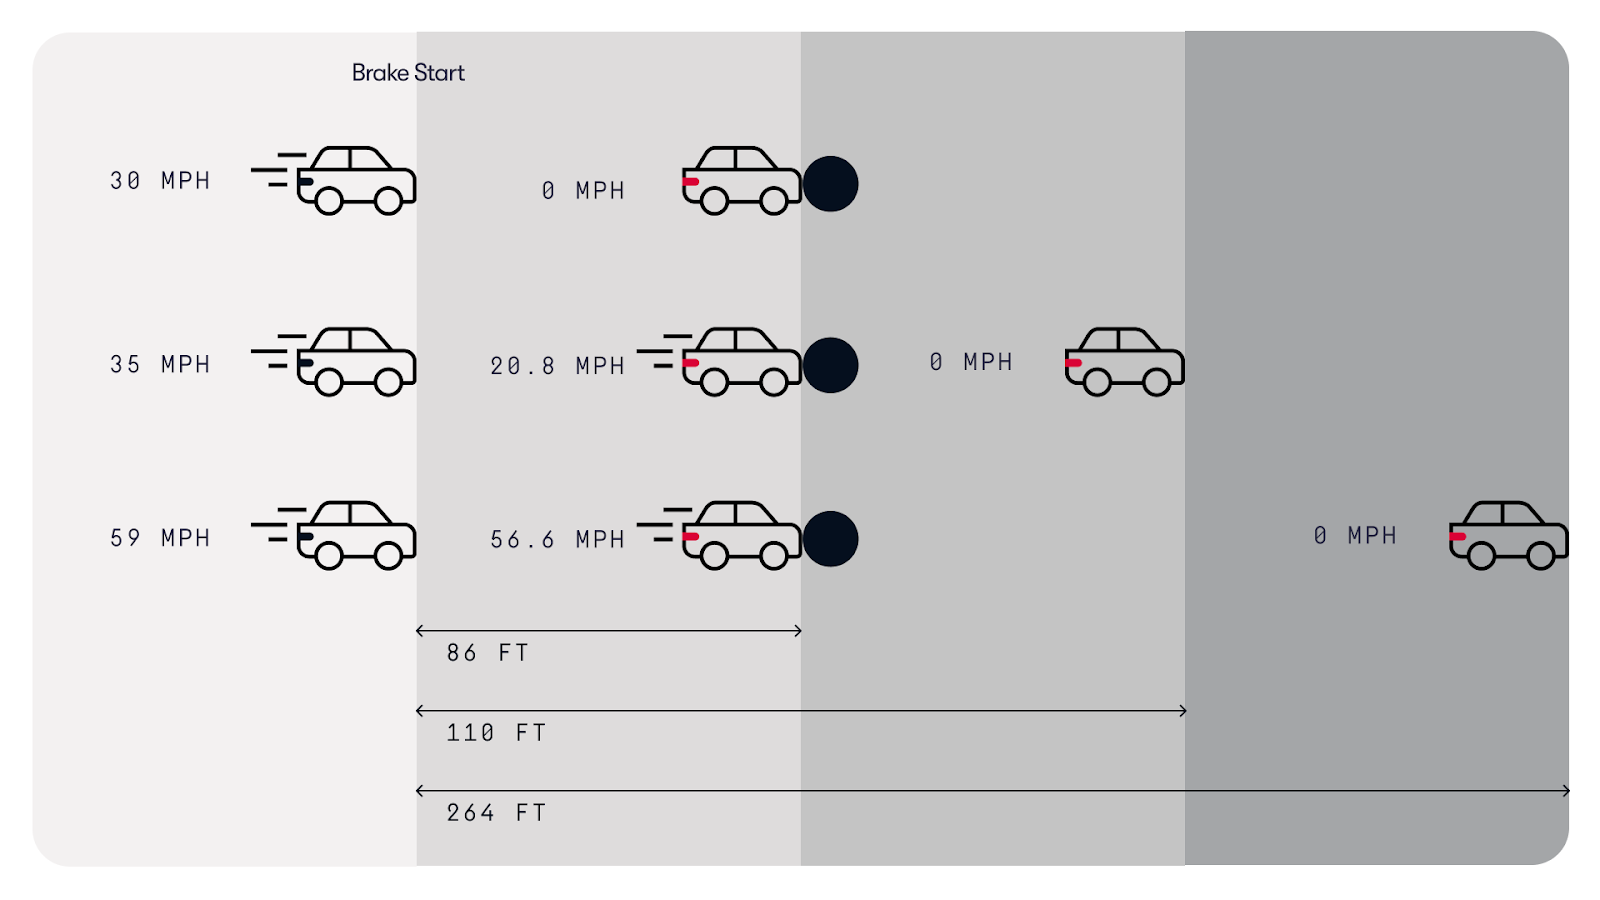
The figure below shows a hypothetical situation where vehicles are traveling 30 mph, 35 mph, and 59 mph (the maximum speed on the 30 mph road that we observed during the study). All three vehicles have the same 0.7 second reaction time — a typical reaction time for a human driver — and apply the brakes hard (a jerk of -25 m/s3 and 0.6 g deceleration) to stop for an object. The first car ends up having a 86 ft brake distance and stops just in front of the object. The brake distance for the second vehicle increases to 110 ft, so it will still be traveling at 20.8 mph when it reaches the object. The third car will hit the object at the speed of 56.6 mph. The probability of a serious injury or fatality increases with every additional mile per hour. For example, every 7 mph increase in impact speed between a car and a pedestrian doubles the odds of a serious injury or fatality.

“The single most impactful thing that we could all do is to slow down,” Mark Chung, executive vice president of roadway practice at National Safety Council (NSC) and a veteran automotive industry insider said in his recent interview. “And speed is among the biggest contributors to the fatalities that we’re seeing on the roadways.”
Managing speeds is essential to keeping streets safe, but too often human drivers ignore the posted speed limit, and road designs can encourage speeding. Our study revealed just how pervasive speeding is in the cities where we operate. Slowing down can save lives, and cities are working hard to lower speed limits and alter road designs to reduce speeding. By respecting the speed limit, the Waymo Driver will contribute to safer streets in places where we operate.
Unlike humans, the Waymo Driver is designed to follow applicable speed limits. Our Driver can also detect the speed of other vehicles on the road. Doing so helps the Waymo Driver predict the likely next maneuvers of the vehicles around it and respond accordingly. This has important safety benefits: for example, if the Waymo Driver detects a car accelerating instead of slowing down for a red light, it will prepare to yield to it.
Examples of speeding behavior in San Francisco and Phoenix (captured outside of the study)
Because we can understand the speeding behavior of other cars, we were able to study speed patterns in San Francisco and Phoenix, where our fully autonomous Waymo One service operates. While it's well known that human drivers speed, quantifying the overall extent of speeding is hard because such incidents are dramatically underreported.
How we observed car speeds
We used our rider-only fleet, with no one behind the wheel, to collect anonymized, aggregate speed data across San Francisco and Phoenix between May 1–5 and May 8–12, 2023. The data was aggregated by speed limit for 25 mph, 30 mph, 35 mph, and 45 mph roads. As the city of San Francisco has a low number of 35 mph and 45 mph roads, only data for 25 mph and 30 mph speed limits is reported for SF.
Data was aggregated based on the posted speed limit of the road from our map. It was not adjusted for temporary or time dependent speed limits, like school or construction zones. While these temporary speed limits are important for safety and factored in the Waymo Driver’s behavior, they are much less common than permanent ones, so including them would not impact the results shown in this study. No information that could identify an individual vehicle was used as part of this study.
During this 10-day time period, we recorded the speeds of hundreds of thousands of vehicles across both cities. This provided us with hours of aggregated speed data and over 1 million speed observations.
.png)
Observed speeding behavior and safety implications
The study revealed that from the data collected, drivers in Phoenix and San Francisco exceeded the speed limit from a quarter (27%) to almost half (47%) of the time observed, depending on the road speed limit.
For the speed limits we examined, human drivers drove more than 5 mph over the speed limit between 7% and 21% of the time. While it may sound innocuous, 5 mph can make a big difference in both avoiding a collision and the consequences of a collision if it occurs. But what’s even more dangerous is extreme speeding. During the 10-day period, we observed vehicles going over 25 mph above the speed limit in every road category we reviewed. This means that drivers regularly go over 50 mph on roads with a 25 mph speed limit, and over 70 mph on roads with a 45 mph speed limit.
The figure below shows a hypothetical situation where vehicles are traveling 30 mph, 35 mph, and 59 mph (the maximum speed on the 30 mph road that we observed during the study). All three vehicles have the same 0.7 second reaction time — a typical reaction time for a human driver — and apply the brakes hard (a jerk of -25 m/s3 and 0.6 g deceleration) to stop for an object. The first car ends up having a 86 ft brake distance and stops just in front of the object. The brake distance for the second vehicle increases to 110 ft, so it will still be traveling at 20.8 mph when it reaches the object. The third car will hit the object at the speed of 56.6 mph. The probability of a serious injury or fatality increases with every additional mile per hour. For example, every 7 mph increase in impact speed between a car and a pedestrian doubles the odds of a serious injury or fatality.
Comparison of human braking distance and speeds between a 30 mph, 35 mph, and 59 mph starting speed. All three vehicles have a brake reaction time of 0.7 seconds, brake jerk of -25 m/s3, brake magnitude of 0.6 g.
“The single most impactful thing that we could all do is to slow down,” Mark Chung, executive vice president of roadway practice at National Safety Council (NSC) and a veteran automotive industry insider said in his recent interview. “And speed is among the biggest contributors to the fatalities that we’re seeing on the roadways.”
Managing speeds is essential to keeping streets safe, but too often human drivers ignore the posted speed limit, and road designs can encourage speeding. Our study revealed just how pervasive speeding is in the cities where we operate. Slowing down can save lives, and cities are working hard to lower speed limits and alter road designs to reduce speeding. By respecting the speed limit, the Waymo Driver will contribute to safer streets in places where we operate.


.gif)


